
Switch-off Britain
On 31 January 2027 the copper phone network switches off for good. We’ve matched Ofcom’s coverage data to every UK council and built-up area. That’s 32.5 million premises. It shows who’s already moved to fibre, and who’s running out of road.

Fibre arrived. Most of Britain stayed put.
The build is nearly done. Half of UK councils now have full fibre passing at least 81% of premises. Coverage is no longer the interesting question.
Take-up is. Of the premises that can get full fibre, the share that has actually ordered it runs from 19% to 78%, depending on the council. That gap is far wider than anything left in the coverage figures. And the copper switches off on a fixed date, whether or not those lines have moved.
Kensington and Chelsea has near-universal fibre and the lowest take-up in the UK. Hull, wired decades before anyone else, has the highest.
| 1 | Kingston upon Hull, City of | Yorkshire & Humber | 131,287 | 99.6% | 78% |
| 2 | Ards and North Down | Northern Ireland | 79,920 | 95.7% | 75% |
| 3 | Mid and East Antrim | Northern Ireland | 66,726 | 95.2% | 74% |
| 4 | Armagh City, Banbridge and Craigavon | Northern Ireland | 97,766 | 92.9% | 73% |
| 5= | Milton Keynes | South East | 133,693 | 96.4% | 72% |
| 5= | Newry, Mourne and Down | Northern Ireland | 79,261 | 95.1% | 72% |
| 7= | Causeway Coast and Glens | Northern Ireland | 71,646 | 93.6% | 71% |
| 7= | Flintshire | Wales | 76,379 | 90.8% | 71% |
| 9 | Midlothian | Scotland | 47,006 | 92.5% | 70% |
| 10= | East Suffolk | East of England | 130,344 | 84.7% | 68% |
| 10= | Fylde | North West | 38,853 | 92.8% | 68% |
| 10= | Mid Sussex | South East | 73,509 | 82.5% | 68% |
| 13= | Antrim and Newtownabbey | Northern Ireland | 66,802 | 96.7% | 67% |
| 13= | Denbighshire | Wales | 51,085 | 81.8% | 67% |
| 13= | Ribble Valley | North West | 32,358 | 86.5% | 67% |
| 16= | Clackmannanshire | Scotland | 26,782 | 86.2% | 66% |
| 16= | Worcester | West Midlands | 49,864 | 93.4% | 66% |
| 18 | Maldon | East of England | 32,172 | 82.2% | 65% |
| 19= | Conwy | Wales | 60,358 | 88.3% | 64% |
| 19= | Derry City and Strabane | Northern Ireland | 69,311 | 94.5% | 64% |
| 19= | Lisburn and Castlereagh | Northern Ireland | 67,906 | 95.4% | 64% |
| 19= | Malvern Hills | West Midlands | 40,643 | 71.7% | 64% |
| 19= | Merthyr Tydfil | Wales | 28,884 | 79.1% | 64% |
| 19= | Moray | Scotland | 51,564 | 64.1% | 64% |
| 19= | South Gloucestershire | South West | 137,521 | 67% | 64% |
| 19= | Swale | South East | 68,734 | 74.3% | 64% |
| 19= | Wyre | North West | 59,514 | 92.4% | 64% |
| 28= | Caerphilly | Wales | 84,772 | 89.7% | 63% |
| 28= | Cheshire West and Chester | North West | 176,089 | 87.8% | 63% |
| 28= | Fermanagh and Omagh | Northern Ireland | 55,383 | 90.9% | 63% |
| 31= | Bromsgrove | West Midlands | 45,875 | 80.3% | 62% |
| 31= | East Devon | South West | 79,343 | 75.2% | 62% |
| 31= | Mid Ulster | Northern Ireland | 63,313 | 94.4% | 62% |
| 34= | Aberdeenshire | Scotland | 131,027 | 48.5% | 61% |
| 34= | Breckland | East of England | 70,310 | 67.3% | 61% |
| 34= | Carmarthenshire | Wales | 95,119 | 73% | 61% |
| 34= | East Riding of Yorkshire | Yorkshire & Humber | 175,994 | 94.5% | 61% |
| 38= | Ashford | South East | 61,757 | 68% | 60% |
| 38= | Coventry | West Midlands | 153,694 | 96.7% | 60% |
| 38= | Lancaster | North West | 69,517 | 87.2% | 60% |
| 38= | Wakefield | Yorkshire & Humber | 174,519 | 94.2% | 60% |
| 38= | Wealden | South East | 78,127 | 75.3% | 60% |
| 43= | Aberdeen City | Scotland | 132,364 | 93.1% | 59% |
| 43= | Barking and Dagenham | London | 85,709 | 90% | 59% |
| 43= | Bridgend | Wales | 68,654 | 93.1% | 59% |
| 43= | East Ayrshire | Scotland | 63,107 | 76.2% | 59% |
| 43= | Epsom and Ewell | South East | 33,911 | 89.8% | 59% |
| 43= | Horsham | South East | 69,757 | 76.3% | 59% |
| 43= | Thanet | South East | 76,458 | 79.2% | 59% |
| 43= | West Lothian | Scotland | 91,512 | 80.4% | 59% |
| 51= | Brentwood | East of England | 36,910 | 84.7% | 58% |
| 51= | Bury | North West | 92,057 | 92.8% | 58% |
| 51= | Cannock Chase | West Midlands | 49,420 | 96.6% | 58% |
| 51= | Cheshire East | North West | 201,908 | 79.2% | 58% |
| 51= | Stirling | Scotland | 47,991 | 77.2% | 58% |
| 51= | Tower Hamlets | London | 158,445 | 82% | 58% |
| 51= | West Lancashire | North West | 54,725 | 85.6% | 58% |
| 58= | Cornwall | South West | 312,395 | 65.3% | 57% |
| 58= | Middlesbrough | North East | 71,097 | 62.6% | 57% |
| 58= | Rochford | East of England | 39,709 | 89.9% | 57% |
| 58= | South Ribble | North West | 56,125 | 85.4% | 57% |
| 58= | Stratford-on-Avon | West Midlands | 71,844 | 82.6% | 57% |
| 58= | Wirral | North West | 160,608 | 94.4% | 57% |
| 64= | Ceredigion | Wales | 39,489 | 58.7% | 56% |
| 64= | Cherwell | South East | 76,130 | 79.3% | 56% |
| 64= | East Cambridgeshire | East of England | 43,045 | 83.4% | 56% |
| 64= | Herefordshire, County of | West Midlands | 94,488 | 82.3% | 56% |
| 64= | Newham | London | 138,461 | 83% | 56% |
| 64= | North Ayrshire | Scotland | 74,751 | 80.2% | 56% |
| 64= | Powys | Wales | 71,500 | 62.1% | 56% |
| 64= | Tunbridge Wells | South East | 55,444 | 75% | 56% |
| 64= | Vale of Glamorgan | Wales | 65,626 | 87.1% | 56% |
| 64= | West Devon | South West | 28,563 | 64.2% | 56% |
| 64= | West Lindsey | East Midlands | 48,959 | 64.4% | 56% |
| 64= | Westmorland and Furness | North West | 129,530 | 81.8% | 56% |
| 76= | Basingstoke and Deane | South East | 86,328 | 66.9% | 55% |
| 76= | Canterbury | South East | 77,452 | 75% | 55% |
| 76= | Chorley | North West | 56,684 | 89.8% | 55% |
| 76= | Greenwich | London | 129,643 | 77.6% | 55% |
| 76= | Lichfield | West Midlands | 52,112 | 73.8% | 55% |
| 81= | Amber Valley | East Midlands | 64,565 | 89.2% | 54% |
| 81= | Bexley | London | 106,226 | 84.2% | 54% |
| 81= | Blaenau Gwent | Wales | 35,720 | 77.6% | 54% |
| 81= | City of London | London | 10,639 | 82.3% | 54% |
| 81= | Doncaster | Yorkshire & Humber | 152,377 | 94.5% | 54% |
| 81= | Dover | South East | 57,998 | 74.8% | 54% |
| 81= | Eastleigh | South East | 63,831 | 71.6% | 54% |
| 81= | Monmouthshire | Wales | 46,720 | 79% | 54% |
| 81= | North East Derbyshire | East Midlands | 51,533 | 87.9% | 54% |
| 81= | Sevenoaks | South East | 54,401 | 67.4% | 54% |
| 81= | Southwark | London | 157,267 | 82.1% | 54% |
| 81= | Swindon | South West | 106,022 | 93.7% | 54% |
| 81= | Three Rivers | East of England | 40,594 | 85.6% | 54% |
| 81= | Tonbridge and Malling | South East | 59,726 | 75% | 54% |
| 81= | Vale of White Horse | South East | 67,555 | 64.3% | 54% |
| 81= | Wiltshire | South West | 242,119 | 69.7% | 54% |
| 81= | Wrexham | Wales | 67,484 | 86.1% | 54% |
| 98= | Chelmsford | East of England | 86,129 | 81.1% | 53% |
| 98= | Chichester | South East | 65,495 | 67.3% | 53% |
| 98= | Cotswold | South West | 49,519 | 72.2% | 53% |
| 98= | East Dunbartonshire | Scotland | 51,129 | 76.1% | 53% |
| 98= | Fife | Scotland | 197,211 | 71.7% | 53% |
| 98= | Isle of Anglesey | Wales | 38,434 | 67.6% | 53% |
| 98= | North Kesteven | East Midlands | 58,144 | 69.6% | 53% |
| 98= | North Somerset | South West | 106,398 | 84.5% | 53% |
| 98= | Shropshire | West Midlands | 159,756 | 74.3% | 53% |
| 98= | South Kesteven | East Midlands | 72,457 | 78.1% | 53% |
| 98= | Tendring | East of England | 79,410 | 79.4% | 53% |
| 98= | Tewkesbury | South West | 49,942 | 75% | 53% |
| 110= | Central Bedfordshire | East of England | 140,078 | 74.4% | 52% |
| 110= | Gwynedd | Wales | 68,491 | 70.7% | 52% |
| 110= | Maidstone | South East | 79,910 | 71.4% | 52% |
| 110= | Perth and Kinross | Scotland | 82,087 | 36.6% | 52% |
| 110= | Redbridge | London | 113,186 | 84.8% | 52% |
| 110= | Rugby | West Midlands | 54,170 | 92.2% | 52% |
| 110= | Scottish Borders | Scotland | 66,240 | 75.7% | 52% |
| 110= | South Cambridgeshire | East of England | 77,917 | 68.1% | 52% |
| 110= | Test Valley | South East | 62,034 | 58% | 52% |
| 110= | Uttlesford | East of England | 42,085 | 76.2% | 52% |
| 110= | West Berkshire | South East | 74,766 | 78.6% | 52% |
| 110= | West Oxfordshire | South East | 56,719 | 84.7% | 52% |
| 110= | West Suffolk | East of England | 88,383 | 79.3% | 52% |
| 110= | Wychavon | West Midlands | 65,578 | 78.2% | 52% |
| 124= | Eastbourne | South East | 51,764 | 92.7% | 51% |
| 124= | Harborough | East Midlands | 47,221 | 77.9% | 51% |
| 124= | Norwich | East of England | 59,400 | 75.2% | 51% |
| 124= | Oldham | North West | 100,701 | 94.1% | 51% |
| 124= | Peterborough | East of England | 97,053 | 94.8% | 51% |
| 124= | Salford | North West | 139,912 | 90.4% | 51% |
| 124= | Sheffield | Yorkshire & Humber | 269,317 | 92.3% | 51% |
| 124= | Somerset | South West | 287,056 | 74.6% | 51% |
| 124= | Spelthorne | South East | 46,582 | 80.5% | 51% |
| 124= | Teignbridge | South West | 68,957 | 73.8% | 51% |
| 124= | Torbay | South West | 77,760 | 83.6% | 51% |
| 135= | Argyll and Bute | Scotland | 58,013 | 23.9% | 50% |
| 135= | Bracknell Forest | South East | 56,577 | 96.7% | 50% |
| 135= | Braintree | East of England | 75,805 | 90.3% | 50% |
| 135= | Chesterfield | East Midlands | 55,160 | 88% | 50% |
| 135= | County Durham | North East | 268,929 | 84.1% | 50% |
| 135= | East Hertfordshire | East of England | 71,295 | 71% | 50% |
| 135= | Elmbridge | South East | 62,685 | 63.1% | 50% |
| 135= | Huntingdonshire | East of England | 88,819 | 78.8% | 50% |
| 135= | Isle of Wight | South East | 79,805 | 87% | 50% |
| 135= | Knowsley | North West | 75,708 | 93.7% | 50% |
| 135= | Leeds | Yorkshire & Humber | 394,243 | 93.1% | 50% |
| 135= | Merton | London | 92,087 | 81.6% | 50% |
| 135= | North Northamptonshire | East Midlands | 172,223 | 88.6% | 50% |
| 135= | North Warwickshire | West Midlands | 31,671 | 75.3% | 50% |
| 135= | South Norfolk | East of England | 70,435 | 70.9% | 50% |
| 135= | Tameside | North West | 115,875 | 92.2% | 50% |
| 135= | Tandridge | South East | 39,630 | 59.5% | 50% |
| 135= | Thurrock | East of England | 73,440 | 85.3% | 50% |
| 135= | Torridge | South West | 36,314 | 60% | 50% |
| 135= | Wandsworth | London | 167,759 | 85.2% | 50% |
| 155= | Basildon | East of England | 84,971 | 74.3% | 49% |
| 155= | Bassetlaw | East Midlands | 61,332 | 77.6% | 49% |
| 155= | Dumfries and Galloway | Scotland | 83,562 | 66.9% | 49% |
| 155= | Epping Forest | East of England | 62,805 | 73.1% | 49% |
| 155= | Exeter | South West | 63,219 | 79.9% | 49% |
| 155= | Mid Devon | South West | 38,610 | 67.2% | 49% |
| 155= | Northumberland | North East | 174,759 | 82.1% | 49% |
| 155= | Reigate and Banstead | South East | 66,155 | 75.5% | 49% |
| 155= | Rushcliffe | East Midlands | 59,030 | 64.8% | 49% |
| 155= | Shetland Islands | Scotland | 13,367 | 20% | 49% |
| 155= | Torfaen | Wales | 47,028 | 73.2% | 49% |
| 155= | Westminster | London | 164,725 | 88.3% | 49% |
| 167= | Bolsover | East Midlands | 40,964 | 89.1% | 48% |
| 167= | Broadland | East of England | 65,407 | 78.1% | 48% |
| 167= | Dartford | South East | 53,329 | 73.5% | 48% |
| 167= | Folkestone and Hythe | South East | 56,402 | 74.5% | 48% |
| 167= | King's Lynn and West Norfolk | East of England | 80,857 | 65.3% | 48% |
| 167= | North Hertfordshire | East of England | 63,390 | 69.6% | 48% |
| 167= | North Tyneside | North East | 105,743 | 84.6% | 48% |
| 167= | Pendle | North West | 45,223 | 93% | 48% |
| 167= | Rossendale | North West | 35,605 | 92.1% | 48% |
| 167= | Rother | South East | 50,368 | 74.4% | 48% |
| 167= | Runnymede | South East | 40,184 | 77.2% | 48% |
| 167= | Rutland | East Midlands | 19,193 | 78.8% | 48% |
| 167= | Southampton | South East | 116,135 | 95% | 48% |
| 167= | Stafford | West Midlands | 68,153 | 72.9% | 48% |
| 167= | St Albans | East of England | 66,276 | 81.7% | 48% |
| 167= | Sutton | London | 88,779 | 78.1% | 48% |
| 167= | Waverley | South East | 59,866 | 68% | 48% |
| 184= | Bedford | East of England | 85,658 | 75.1% | 47% |
| 184= | Belfast | Northern Ireland | 174,558 | 92.3% | 47% |
| 184= | Dacorum | East of England | 71,169 | 68.3% | 47% |
| 184= | Hastings | South East | 47,324 | 83.6% | 47% |
| 184= | Highland | Scotland | 137,076 | 63.3% | 47% |
| 184= | Hyndburn | North West | 41,812 | 93.4% | 47% |
| 184= | Kirklees | Yorkshire & Humber | 202,870 | 92.9% | 47% |
| 184= | Lewes | South East | 49,391 | 74.4% | 47% |
| 184= | Newcastle upon Tyne | North East | 145,462 | 86.9% | 47% |
| 184= | Rhondda Cynon Taf | Wales | 121,242 | 80% | 47% |
| 184= | Slough | South East | 59,322 | 91.5% | 47% |
| 184= | South Hams | South West | 51,519 | 58.6% | 47% |
| 184= | Waltham Forest | London | 116,847 | 87.4% | 47% |
| 184= | Worthing | South East | 54,689 | 93.3% | 47% |
| 198= | Adur | South East | 30,449 | 76.9% | 46% |
| 198= | Babergh | East of England | 46,716 | 75.4% | 46% |
| 198= | Gravesham | South East | 47,069 | 73% | 46% |
| 198= | Newport | Wales | 75,576 | 87.6% | 46% |
| 198= | Orkney Islands | Scotland | 13,362 | 30% | 46% |
| 198= | Pembrokeshire | Wales | 67,326 | 69.2% | 46% |
| 198= | South Derbyshire | East Midlands | 52,037 | 92.2% | 46% |
| 198= | Welwyn Hatfield | East of England | 52,174 | 60.1% | 46% |
| 198= | Wokingham | South East | 78,179 | 84.2% | 46% |
| 207= | Arun | South East | 83,410 | 82.3% | 45% |
| 207= | Buckinghamshire | South East | 250,031 | 74.5% | 45% |
| 207= | Cardiff | Wales | 172,880 | 87% | 45% |
| 207= | Derbyshire Dales | East Midlands | 39,191 | 63.3% | 45% |
| 207= | Dorset | South West | 197,995 | 75.8% | 45% |
| 207= | Fenland | East of England | 50,659 | 84.2% | 45% |
| 207= | Forest of Dean | South West | 43,509 | 79.5% | 45% |
| 207= | Harrow | London | 102,944 | 77.7% | 45% |
| 207= | Hillingdon | London | 124,948 | 80.6% | 45% |
| 207= | Liverpool | North West | 237,006 | 88% | 45% |
| 207= | Manchester | North West | 262,217 | 86.7% | 45% |
| 207= | Nuneaton and Bedworth | West Midlands | 64,700 | 70.3% | 45% |
| 207= | Redditch | West Midlands | 40,342 | 49.6% | 45% |
| 207= | South Oxfordshire | South East | 70,912 | 74.9% | 45% |
| 207= | Stockton-on-Tees | North East | 93,612 | 59.6% | 45% |
| 207= | Walsall | West Midlands | 120,545 | 86.1% | 45% |
| 207= | Warrington | North West | 102,417 | 92.2% | 45% |
| 207= | Wyre Forest | West Midlands | 50,157 | 82.2% | 45% |
| 225= | Cumberland | North West | 149,392 | 83.5% | 44% |
| 225= | Great Yarmouth | East of England | 50,682 | 82.8% | 44% |
| 225= | Guildford | South East | 61,772 | 65.6% | 44% |
| 225= | Halton | North West | 63,134 | 88.7% | 44% |
| 225= | North Devon | South West | 54,147 | 60.9% | 44% |
| 225= | Rotherham | Yorkshire & Humber | 129,292 | 94.7% | 44% |
| 225= | South Lanarkshire | Scotland | 168,033 | 68.8% | 44% |
| 225= | South Staffordshire | West Midlands | 51,799 | 83.6% | 44% |
| 225= | South Tyneside | North East | 76,597 | 66.4% | 44% |
| 225= | Watford | East of England | 45,444 | 87.8% | 44% |
| 235= | Bristol, City of | South West | 219,825 | 83.4% | 43% |
| 235= | Broxtowe | East Midlands | 53,924 | 86.8% | 43% |
| 235= | Darlington | North East | 56,837 | 86.7% | 43% |
| 235= | Erewash | East Midlands | 56,638 | 93.6% | 43% |
| 235= | Gedling | East Midlands | 57,888 | 84.5% | 43% |
| 235= | Glasgow City | Scotland | 346,722 | 92% | 43% |
| 235= | High Peak | East Midlands | 47,534 | 85.3% | 43% |
| 235= | Lewisham | London | 142,852 | 78.5% | 43% |
| 235= | Medway | South East | 126,910 | 81.2% | 43% |
| 235= | Na H-Eileanan Siar | Scotland | 17,811 | 12% | 43% |
| 235= | Newark and Sherwood | East Midlands | 62,078 | 81.8% | 43% |
| 235= | North West Leicestershire | East Midlands | 51,974 | 79.5% | 43% |
| 235= | Solihull | West Midlands | 100,243 | 81.2% | 43% |
| 235= | Stroud | South West | 60,255 | 79.9% | 43% |
| 235= | Swansea | Wales | 120,319 | 85.3% | 43% |
| 235= | Trafford | North West | 111,129 | 92.6% | 43% |
| 235= | Windsor and Maidenhead | South East | 69,820 | 77.6% | 43% |
| 252= | Barnet | London | 167,914 | 69.7% | 42% |
| 252= | Bromley | London | 148,822 | 69.2% | 42% |
| 252= | Derby | East Midlands | 122,861 | 88% | 42% |
| 252= | East Lindsey | East Midlands | 76,235 | 64% | 42% |
| 252= | Havering | London | 115,624 | 84.5% | 42% |
| 252= | Lambeth | London | 157,530 | 83.5% | 42% |
| 252= | New Forest | South East | 88,661 | 75.4% | 42% |
| 252= | Reading | South East | 79,541 | 95.6% | 42% |
| 260= | Angus | Scotland | 62,607 | 58.9% | 41% |
| 260= | Boston | East Midlands | 34,891 | 80% | 41% |
| 260= | Burnley | North West | 46,756 | 92.4% | 41% |
| 260= | East Hampshire | South East | 60,335 | 62.7% | 41% |
| 260= | East Renfrewshire | Scotland | 42,896 | 88.8% | 41% |
| 260= | East Staffordshire | West Midlands | 59,419 | 82.1% | 41% |
| 260= | Fareham | South East | 53,634 | 91.7% | 41% |
| 260= | Gosport | South East | 39,455 | 92% | 41% |
| 260= | Hart | South East | 44,658 | 75.6% | 41% |
| 260= | Hinckley and Bosworth | East Midlands | 56,664 | 75.9% | 41% |
| 260= | Ipswich | East of England | 66,242 | 95.4% | 41% |
| 260= | Kingston upon Thames | London | 72,866 | 71.2% | 41% |
| 260= | North Yorkshire | Yorkshire & Humber | 328,672 | 82.3% | 41% |
| 260= | Rochdale | North West | 104,136 | 87.7% | 41% |
| 260= | Staffordshire Moorlands | West Midlands | 47,700 | 71.4% | 41% |
| 260= | Stockport | North West | 142,123 | 87.6% | 41% |
| 276= | Bath and North East Somerset | South West | 90,941 | 72.9% | 40% |
| 276= | Blaby | East Midlands | 46,743 | 90.5% | 40% |
| 276= | City of Edinburgh | Scotland | 290,522 | 84.2% | 40% |
| 276= | Hammersmith and Fulham | London | 96,829 | 85.4% | 40% |
| 276= | Melton | East Midlands | 26,713 | 67.2% | 40% |
| 276= | North Lanarkshire | Scotland | 169,925 | 72.6% | 40% |
| 276= | Sandwell | West Midlands | 145,257 | 91.2% | 40% |
| 276= | Sefton | North West | 140,780 | 84.2% | 40% |
| 276= | Sunderland | North East | 141,891 | 80.6% | 40% |
| 276= | Telford and Wrekin | West Midlands | 89,421 | 57.5% | 40% |
| 276= | Wigan | North West | 160,777 | 87.7% | 40% |
| 287= | Bradford | Yorkshire & Humber | 236,231 | 91.3% | 39% |
| 287= | Cheltenham | South West | 60,845 | 86% | 39% |
| 287= | Colchester | East of England | 91,412 | 68% | 39% |
| 287= | Falkirk | Scotland | 77,807 | 71% | 39% |
| 287= | Hertsmere | East of England | 47,748 | 72.3% | 39% |
| 287= | Hounslow | London | 107,464 | 65.9% | 39% |
| 287= | Mole Valley | South East | 40,988 | 70.8% | 39% |
| 287= | Neath Port Talbot | Wales | 69,680 | 78.1% | 39% |
| 295= | Broxbourne | East of England | 44,673 | 74.3% | 38% |
| 295= | Hartlepool | North East | 49,075 | 95.7% | 38% |
| 295= | Mansfield | East Midlands | 54,727 | 85.7% | 38% |
| 295= | North Lincolnshire | Yorkshire & Humber | 82,674 | 93.1% | 38% |
| 295= | Renfrewshire | Scotland | 98,798 | 92.4% | 38% |
| 295= | Richmond upon Thames | London | 89,806 | 70.4% | 38% |
| 295= | South Holland | East Midlands | 47,597 | 76.4% | 38% |
| 295= | St. Helens | North West | 90,219 | 94.5% | 38% |
| 295= | York | Yorkshire & Humber | 97,922 | 86.6% | 38% |
| 304= | Barnsley | Yorkshire & Humber | 120,747 | 88.5% | 37% |
| 304= | Birmingham | West Midlands | 495,645 | 85.6% | 37% |
| 304= | Brent | London | 144,962 | 77.8% | 37% |
| 304= | Croydon | London | 175,754 | 70.7% | 37% |
| 304= | Ealing | London | 161,460 | 72% | 37% |
| 304= | Hackney | London | 129,955 | 84.1% | 37% |
| 304= | Preston | North West | 74,770 | 86% | 37% |
| 304= | South Ayrshire | Scotland | 60,868 | 71.3% | 37% |
| 304= | Stevenage | East of England | 40,195 | 56.8% | 37% |
| 304= | Warwick | West Midlands | 73,506 | 61.4% | 37% |
| 314= | Bolton | North West | 137,545 | 88.1% | 36% |
| 314= | Castle Point | East of England | 41,984 | 85.1% | 36% |
| 314= | Dundee City | Scotland | 81,909 | 85.8% | 36% |
| 314= | East Lothian | Scotland | 57,359 | 87.8% | 36% |
| 314= | Haringey | London | 114,429 | 61.6% | 36% |
| 314= | North Norfolk | East of England | 62,089 | 54.5% | 36% |
| 314= | Winchester | South East | 61,397 | 58.4% | 36% |
| 321= | Calderdale | Yorkshire & Humber | 104,549 | 85.9% | 35% |
| 321= | Charnwood | East Midlands | 82,242 | 88.7% | 35% |
| 321= | Mid Suffolk | East of England | 53,972 | 62.4% | 35% |
| 321= | Wolverhampton | West Midlands | 120,254 | 95.9% | 35% |
| 325= | Bournemouth, Christchurch and Poole | South West | 202,347 | 79.4% | 34% |
| 325= | Cambridge | East of England | 61,820 | 89.4% | 34% |
| 325= | Havant | South East | 59,774 | 69.4% | 34% |
| 325= | Nottingham | East Midlands | 146,492 | 89.6% | 34% |
| 325= | Portsmouth | South East | 95,584 | 87.6% | 34% |
| 330= | Blackburn with Darwen | North West | 70,158 | 89.4% | 33% |
| 330= | Crawley | South East | 50,361 | 68% | 33% |
| 330= | Oadby and Wigston | East Midlands | 26,099 | 95% | 33% |
| 330= | Rushmoor | South East | 45,277 | 90.7% | 33% |
| 330= | Stoke-on-Trent | West Midlands | 125,810 | 89.5% | 33% |
| 330= | Woking | South East | 46,193 | 75.8% | 33% |
| 336= | Leicester | East Midlands | 148,930 | 94.4% | 32% |
| 336= | Newcastle-under-Lyme | West Midlands | 62,179 | 78.5% | 32% |
| 336= | Plymouth | South West | 128,670 | 78.2% | 32% |
| 339= | Ashfield | East Midlands | 61,160 | 88.5% | 31% |
| 339= | Inverclyde | Scotland | 42,546 | 58.3% | 31% |
| 339= | Lincoln | East Midlands | 50,848 | 86.8% | 31% |
| 339= | Luton | East of England | 88,874 | 91.6% | 31% |
| 339= | West Northamptonshire | East Midlands | 196,164 | 93.5% | 31% |
| 344= | Brighton and Hove | South East | 145,440 | 68.9% | 29% |
| 344= | Gateshead | North East | 103,311 | 77% | 29% |
| 344= | Surrey Heath | South East | 40,131 | 73.8% | 29% |
| 347 | Redcar and Cleveland | North East | 70,507 | 60.3% | 28% |
| 348 | Tamworth | West Midlands | 37,121 | 88.5% | 27% |
| 349= | Camden | London | 122,089 | 86.9% | 26% |
| 349= | Enfield | London | 137,604 | 59.5% | 26% |
| 349= | Harlow | East of England | 42,481 | 41.9% | 26% |
| 349= | North East Lincolnshire | Yorkshire & Humber | 76,553 | 80.1% | 26% |
| 353= | Dudley | West Midlands | 149,747 | 89.7% | 25% |
| 353= | Gloucester | South West | 62,442 | 77.7% | 25% |
| 355= | Islington | London | 120,274 | 84.4% | 24% |
| 355= | Southend-on-Sea | East of England | 87,926 | 97.6% | 24% |
| 357 | West Dunbartonshire | Scotland | 48,494 | 54.9% | 23% |
| 358= | Blackpool | North West | 79,872 | 83.9% | 22% |
| 358= | Oxford | South East | 69,368 | 57.1% | 22% |
| 360 | Isles of Scilly | South West | 1,711 | 50.2% | 20% |
| 361 | Kensington and Chelsea | London | 97,970 | 73% | 19% |
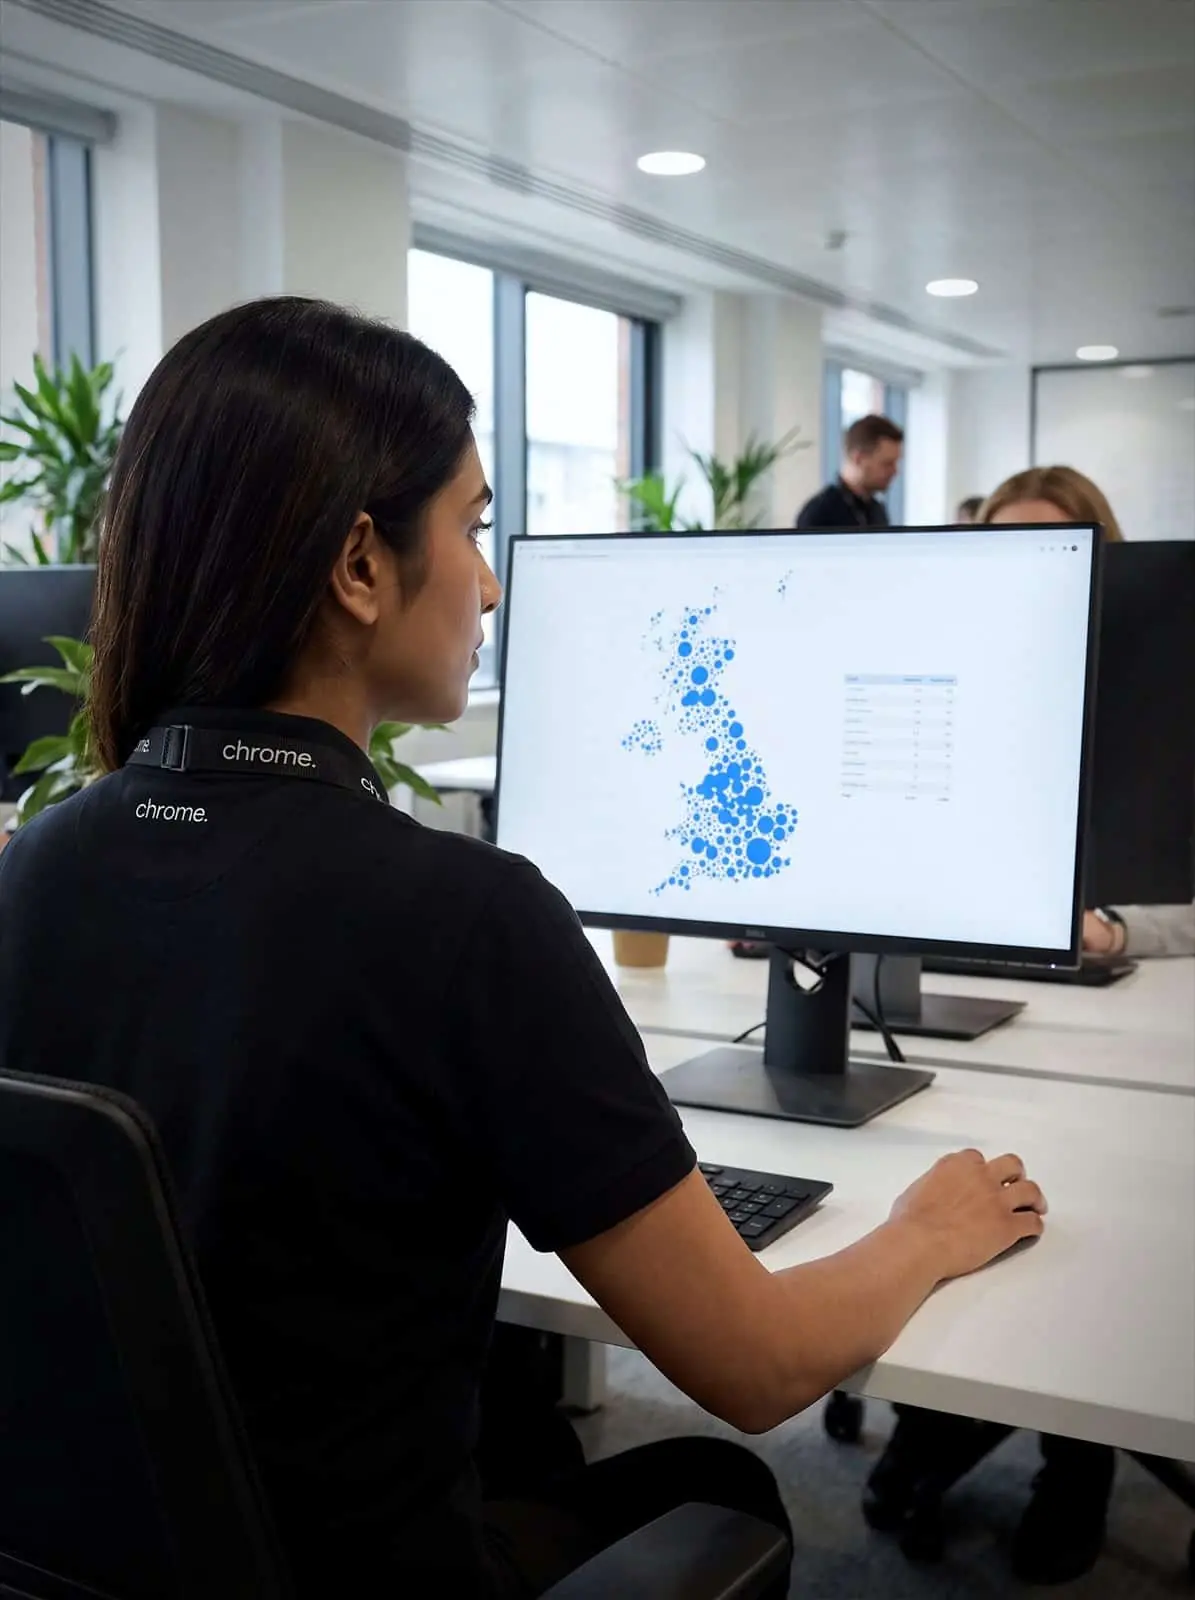
Every dot is one council, placed at the centre of its premises and sized by how many it has. There’s no map underneath. The shape of the country comes entirely from where its buildings are. Switch to Switch-off notspots to see the towns with no gigabit line to move to. Councils on the same take-up figure share a rank, shown with an equals sign.
The places with nowhere to go
Adoption is a choice. For 581 built-up areas it isn’t one, because there’s still no gigabit-capable line to move to.
These are the towns and villages where fewer than half of premises can order a gigabit service. Between them they hold 590,792 premises. In 150 of them the figure is under 10%. When the copper network switches off, the fallback for these lines isn’t fibre. It’s whatever fixed wireless, 4G or satellite can be made to work.
They cluster where you’d expect: on the rural fringe of otherwise well-served counties, where the commercial build stopped at the edge of town.
Get the report for your postcode
Tell us your postcode and we’ll build you a one-page report: how many premises near you can get full fibre, how many have moved, how your council compares with its five nearest neighbours, and the closest places with no gigabit line to move to. It opens straight away and a copy goes to your inbox.
If your lines are still on copper, the clock is the problem
Nothing in this data stops on 31 January 2027 by itself. Analogue lines do. Alarms, lifts, door entry, card machines and fax lines often sit on the same copper. They’re the ones that get missed until the dial tone goes.
If you’re not sure what’s actually connected to a copper line in your building, it’s worth finding out now rather than in the last quarter. Speak to our team and we’ll talk you through it.
Method and sources
Coverage figures come from Ofcom’s Connected Nations Spring 2026 update, published 13 May 2026 and describing the network as at January 2026. We used the output-area file, which covers 238,878 areas and is the only release that carries premises counts. We matched it to the ONS Postcode Directory (May 2026) on 2021 output areas, then aggregated to built-up areas and councils, weighted by premises. 238,873 of 238,878 output areas matched.
- Take-up is full-fibre connections as a share of premises where full fibre is available. Ofcom publishes it at council level only, so we show it as council context and don’t use it to rank towns.
- Gigabit availability includes full fibre and Virgin Media O2’s cable network, following Ofcom’s definition.
- Built-up areas use the ONS 2024 geography, which covers England and Wales only. Scotland and Northern Ireland appear at council level.
- Places under 500 premises are excluded. 31.5m of the UK’s 32.5m premises are represented.
Next refresh: Connected Nations 2026 is expected in mid-to-late November 2026 and will move the coverage snapshot to September 2026.